REGRESSION
Exploratory Regression
Ordinary Least Squares Regression
I ran three OLS models with different combinations of variables that were highlighted in the exploratory regression and in my research question.
I found the following coefficients which indicate the strength and the type of relationship each explanatory variable has to the dependent variable. Highlighted are the variables of interest due to their high value or negative sign (negative correlation is indicated).
OLS 1: Parks/Teens/Poverty/Light
# Parks: 2909.43
% Teen: -326.01
%Poverty: 318.58
Lightperacre: 1184.09
OLS 2: Parks/Canopy/Poverty/Light
# PARKS 3107.74
% CANOPY -134.56
% POVERTY 248.90
LIGHTPERACRE 1212.94
OLS 3: Poverty/Percent Park/Light
% POVERTY 317.26
% PARK 21.34
LIGHTPERACRE 1288.51
Geographically Weighted Regression
I conducted a Geographically Weighted regression with each of the variables of interest identified above. I displayed the local r-squared values using a geometric interval classification. This analysis depicts the regions of the city where each variable is a more or less strong explanatory variable for local crime rates.


Zoning Context
I classified all the different zoning categories into four major ones: Commercial, Residential, Industrial and Open Space. This allowed me to compare the GWR r-squared values for each variable to the distribution of zoning types across the city.

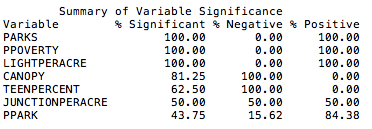
An exploratory regression was run with 7 candidate variables to determine the variables that best explained the distribution of crime in Portland. The candidate variables included the number of parks, the percentage of the population under the poverty level, the amount of streetlights per acre, the percent canopy coverage, the percentage of teens, the number of junctions per acre and the percentage of park cover.
Overall, the results showed a high adjusted r-squared values which means that the crime rate was at least partially explained by chosen variables: they explained up to 35% of model, depending on the combination of variables. Of “Choose 4 of 7” options in Exploratory result, the best model (with the highest AdjR2 values one of the lowest AICc) was explained by number of parks, % aged 10-19, % under poverty level and lighting density.
By looking at the summary of variable significance, number of parks is very significant, positively correlated with crime rate (which can be attributed to the fact that more parks are found in higher density/larger block groups), percent poverty and light per acre are also positively correlated with crime rate with a high significance. Canopy percent cover also has a high significance and is negatively correlated with crime rate. The presence of teens is negatively correlated with crime rate, surprisingly, and percent park area has a low significance and is mostly positively correlated with crime rate and sometimes negatively correlated.